Cp, Cpk, and PPM are statistical calculation parameters commonly used to improve the quality and lower the costs of manufactured products. The calculations are associated with statistical process control or SPC, which is widely applied for monitoring of production and as part of product design.
For production, SPC monitors for trends in real time that can lead to costly quality issues. For example, production quality can vary due to factors such as machine tool wear, different operators, changes in materials, or fluctuations in ambient temperatures.
For mechanical designers, Cp, Cpk and PPM values help analyze the impacts of their Geometric Dimensioning and Tolerancing (GD&T) decisions on the robustness of their design for meeting functional requirements, such as for positions, motions, or force levels. These tools are frequently a part of Design for Six Sigma (DFSS) programs in use by many manufacturers.
This article covers the use of these statistical tools for tolerance analysis and overviews:
What is Cp?
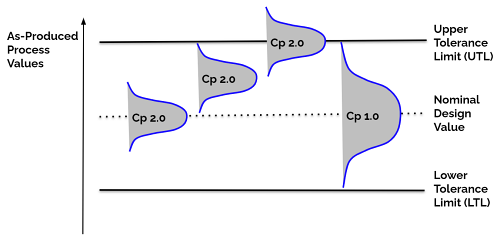
Cp, short for capability process, is the statistical spread of a process value within its tolerance limits. For manufacturing of mechanical products, those values are typically for dimensions and geometries of parts and assemblies, but also frequently include functional characteristics such as for forces or kinematic movements.
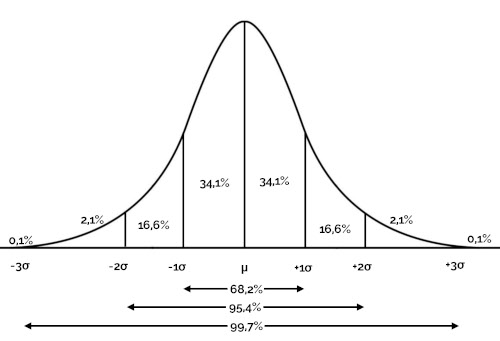
Cp is calculated by dividing the size of the tolerance range by the size of statistical spread. The spread can be modeled by any type of statistical distribution, however, it is mostly commonly assumed in tolerance analysis to be a Gaussian, or normal bell-shaped, distribution at plus/minus three standard deviations, or ±3 sigmas, which totals to 6 sigmas. At ±3 sigmas the spread represents 99.7% of parameter values.
Here’s the formula:
Cp = (UTL – LTL) / (6·sigma)
where UTL is the Upper Tolerance Limit and LTL is the Lower Tolerance Limit.
As you can see in Figure 1, if the spread equals the range, then Cp= 1. If the spread is half the range, then Cp = 2. The higher the Cp, the less variation in the manufacturing process. In general, higher Cp values are desired. But higher Cp values are usually more costly to produce, a fact that a designer must take into account in making decisions about the combination of process spread and tolerance values.
What is Cpk?
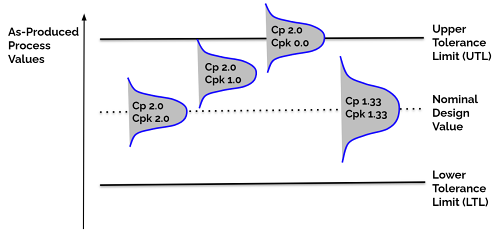
Cpk stands for capability process index. While Cp provides insight into the risk of a production variance leading to out-of-tolerance components, it is an incomplete picture. For instance, a process with a high Cp, or relatively low variability, that is way off center within a range, being very close to a tolerance limit, can still have a high risk of being out of specification. In figure 1, you can see an example of an off-center process values with a tight Cp index of 2 centered on the upper tolerance limit, which means that half of the production would be out of spec.
Cpk captures both the position of a process relative to the limits of the tolerance range and its spread.
Its formula is:
Cpk = MAXIMUM {(Mean – LTL) / (3·sigma), (UTL – Mean) / (3·sigma)}
where Mean is the average for the process values, UTL is the Upper Tolerance Limit, and LTL is the Lower Tolerance Limit
Like with Cp, higher Cpk values are desired. And like with Cp, there are tradeoffs between designing for higher Cpk values and costs. You can see in Figure 2 illustrations for several Cpk values.
In Enventive’s experience, we find that many manufacturers assess Cpk values as follows:
- Cpk < 1.0 : The manufacturing process will not reliably meet the design goals, resulting in excessively high failure rates.
- Cpk = 1.33 to 1.67: The process will perform well, effectively balancing quality and costs of production. What part of this range is preferred will vary by process.
- Cpk > 2 : The process limits are excessively large relative to process variability, it could be possible to either tighten limits to increase quality while keeping costs the same or to loosen the tolerancing of parts to lower costs.
What is PPM?
PPM, or parts per million, is widely used in manufacturing to measure failure rates of a part, assembly, or process. For tolerance analysis, the failure rate is the predicted number of times per million the manufactured item will exceed its designed tolerance for a specific sigma value.
For example, if the sigma value is such that the Cpk = 1, which you can see an example of in Figure 2, then the percentage of the normal curve area that spills over the upper and/or lower tolerance limits calculates to .27%, or 2700 PPM. For Cpk = 1.33, seen in Figure 2, the PPM is 64. When Cpk = 2, also seen in Figure 2, the calculation works out to be 0.002 PPM.
So it can be seen that PPM failure rates drop dramatically with small increases in Cpk indexes, which is something that a designer should keep in mind as decisions are made.
How are acceptable PPM levels determined?
At the beginning of a product design project, expectations for the performance of functional conditions are set based on an understanding of what customers will want or need. These conditions commonly describe dimensional positions or kinematic motions for a mechanism. They can also include, for instance, forces, bending of components, or thermal effects. Designers set the functional expectations, or functional criteria, based on a risk analysis and their judgements.
For risk analysis, design engineers typically conduct a failure modes and effects analysis (FMEA) to identify possible types of failures and their root causes that will endanger a product’s expected functions. The severity of each failure mode for end users is assessed along with ways to eliminate or mitigate the failure and what an acceptable PPM failure rate would be. For example a functional requirement that is safety related, which would be with a high severity, will very likely be designed to have a substantially lower PPM value versus a functional requirement that is related to appearance.
Using Cp, Cpk, and PPM for tolerance analysis
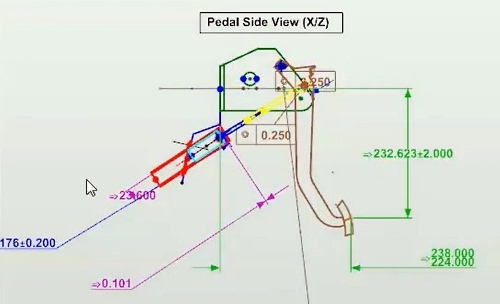
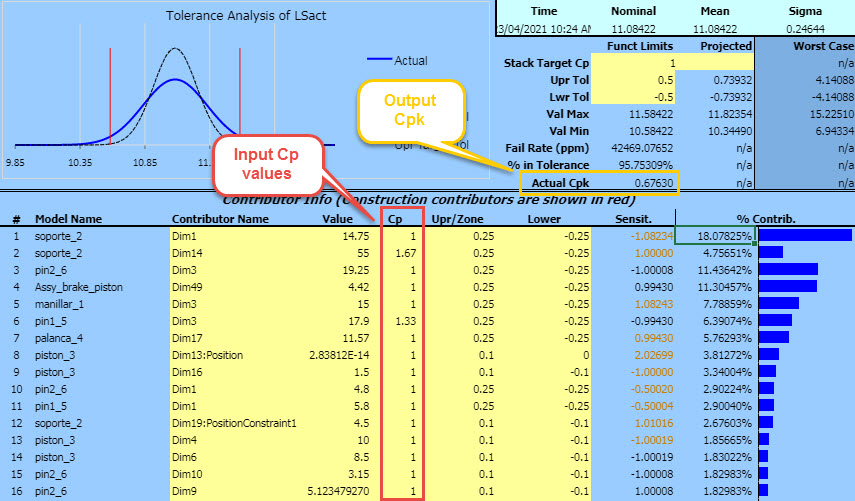
To illustrate the role of Cp, Cpk, and PPM as statistical parameter tools for tolerance analysis, we’ll use Enventive’s Concept product, which is for functional tolerance analysis. You can see an example report screen from Concept below for a brake mechanism model. In this case the functional condition of interest is for linear movement of the brake pedal.
In the upper right of the report you can see that Concept has calculated a PPM failure rate of about 42,469 for the modeled design values, which is about 4.25%. How did Concept determine this PPM value and what does this mean for the design process?
With Concept, designers visually model a mechanism, similar to how it is done in a Computer Aided Design (CAD) system. That visual model shows each mechanism component, how they are connected into an assembly, and their geometrical dimensioning and tolerancing (GD&T) values. These inputs are “driving parameters” for the model.
Concept automatically does all the complex mathematical calculations based on the driving parameters, as input by a designer, needed for determining outputs, or the “driven parameters,” which in this example are for the brake pedal movement. The driven parameters are what are needed to undertake a tolerance analysis.
Tolerance analysis model inputs
In this example, you can see driving parameter values input by the designer within the yellow regions of the report:
- Model Name column — Lists each component in the mechanism that in combination deliver on the functional condition, in other words the stack of components (also known as stackup) needed for tolerance analysis of the functional condition. Based on the visual model of the mechanism, Concept’s mathematics engine automatically determines which of these components to include for any given functional condition.
- Contributor Name column — Lists each component’s dimensional and geometric parameters that together as part of the mechanism’s stackup are contributing factors in calculating the functional condition. Concept automatically identifies these contributors for each component within the stackup.
- Value — The nominal design value of the contributing factor as set by the designer.
- Cp — The Cp values set by the designer, using their judgment, for each contributor. As discussed above, larger values mean less dimensional variation in the component but also usually cost more to produce.
- Upr/Zone — The upper tolerancing limit as set by the designer for the contributor’s nominal value.
- Lower — The lower tolerancing limit as set by the designer.
- Stack Target Cp — The targeted Cp for the functional condition values.
- Upr Tol — The tolerance range above the stack’s nominal functional condition value.
- Lwr Tol — The tolerance range below the stack’s nominal functional condition value.
Tolerance analysis outputs
Based on the brake mechanism model and its driving parameter inputs above, a software tool like Enventive Concept automatically and immediately calculates the projected PPM failure rate and other driven parameter outputs to support decision making. Here are the key outputs related to determining PPM:
- Nominal — The nominal value for the functional condition, which in this example is 11.08422. This is calculated based on the nominal geometric and dimensional values input by the designer for the components making up the brake mechanism stack.
- Worst Case — This is a basic calculation that assumes each contributor is at either the upper or lower limit of its tolerance range within the stack of interest. By combining all these upper and lower limit values Concept reports on the worst case values for the functional condition, which in this scenario is a maximum possible value of 15.225 and minimum of 6.94. In practice, the odds of an assembly being at the worst case situation are extremely small. Almost always statistical approaches like those described in this article are applied for decision making.
- Projected Mean, Sigma, Val Max, and Val Min — These are the projected mean, sigma, maximum, and minimum values for the stack’s functional condition. Concept completes a stackup calculation to determine the statistical mean and range of the functional condition using the nominal and Cp values for each contributor. Enventive finds that the majority of the time its users apply a root sum squared (RSS) stackup calculation. An alternative method for stackup calculations when the distribution of component variances are non-Gaussian or there are non-linear movements, such as with cams, is to apply Monte Carlo simulation. To learn more about these calculation methods (and worst case) and their trade-offs, please see our article “What are Worst Case, RSS, and Monte Carlo Calculation Methods and When to Use Them in Tolerance Analysis.”
- Actual Cpk — Using the projected mean, sigma, maximum, and minimum values, Concept has what it needs to then calculate a Cpk value for the entire stackup’s functional condition using the formula given above. In this example it ends up at .6763, which would generally be considered too low of a value, as noted in the above Cpk section.
- Fail Rate (ppm) — Once a Cpk value has been estimated, it is a straightforward statistical calculation to determine how much of the distribution falls outside the upper and/or lower tolerance limits. In this case, not surprisingly given the low Cpk, the failure rate is projected to be a high 42,469 ppm, or about 4.25%.
Converging on decisions for robust design
So in this example you have a candidate design that is projected to have an excessively high failure rate of 4.25% — in other words a design that is NOT sufficiently robust to functionally perform as expected. How can a designer make robust GD&T design decisions using Cp, Cpk, and PPM statistical parameters?
With Concept, the designer rapidly iterates on driving parameter values to immediately see output changes for the driven parameter values, including the PPM rate. The designer can easily change any of the nominal, Cp, upper tolerance limit, or lower tolerance limit values for one or more of the contributors and then view the PPM result immediately.
A tolerance analysis tool like Concept also offers a designer helpful insights for speeding up their iterations. You can see in the report screen that there is a Sensitivity and a % Contributor column that lists values for each contributor. Concept’s mathematical engine calculates these driven parameters immediately. Sensitivity tells the designer how much geometric changes to a contributor will impact the functional condition’s standard deviation value. It is a purely geometrical value, that depends on the design geometries. Small changes in a lever for instance can have large changes in the model outputs.
Percent contributor values represent how much each contributor is impacting the variability of the functional condition. Each of these values is a function of that contributor’s standard deviation and sensitivity. The sum of all contributor percentages is 100%.
These kinds of insights guide a designer where to focus their efforts. To optimize a design, the designer will first look at the contributor parameters with the highest percent values. For instance in the report screen you can see that three of the contributors are at over 10% contribution towards the functional condition’s standard deviation. Focusing iterations on values related to these contributors are most likely to be the fastest way to drive down PPM levels to acceptable rates. For example, increasing the Cp value and lowering the upper and lower tolerance limits for these three contributors could quickly bring functional condition variance and its projected PPM value down to an acceptable level. The designer could decide to change sensitivities, however this would require a change in the product’s design architecture with new GD&T values.
Other areas of iteration can include the input values for the functional condition’s stack Cp and upper and lower tolerance limits. The design might try, for instance, a stack Cp value of 1.33 instead of 1.0 and/or changing the limits. However, typically these functional condition values are set by the designer as fixed. As a result, the majority of the time iterations focus on the contributors.


